Charts
Reputation Data represents the patient reviews of the practice and/or a practice's practitioners.
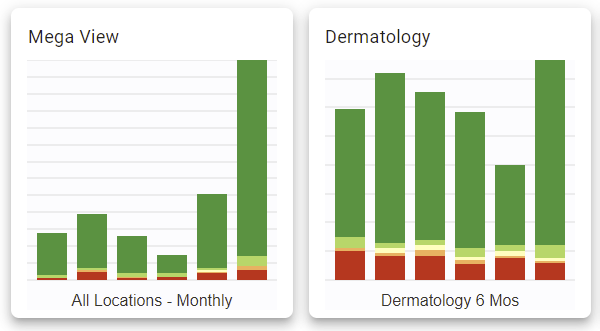
The visualizations created with reputation data may contain one (1) or more charts. Charts are views or patient reviews of the practice and/or a practice's practitioners that cover a specific timeframe. These charts can be viewed within the system anytime or you can define a schedule to send this data via email.
Creating a New Visualization
In order to create a new visualization, location review sites must first be configured. These are configured under Organization / Locations / {site} / Review Sites.
To create a new data visualization:
- Click CREATE.
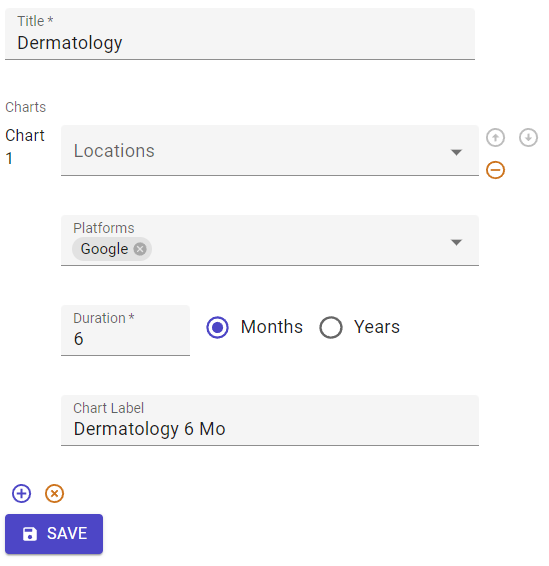
- Supply a title for the visualization. The title is mandatory and is used to identify the collection of data you will be collecting. It is recommended to supply a title that will help identify the data found within. For example, US-West, South Texas, New York Offices, or Monthly Reviews.
- In the Locations field, if no specific location is selected, then reviews for all locations will be included.
- In the Platforms field, select one (1) or more review platforms. If no specific platform is selected, then reviews from all defined review platforms will be included.
- Define a Duration. The two (2) components of duration are the selection of Months or Years and how many months or years to include in the chart data. Duration is mandatory.
- Chart Label is used to provide a custom name as seen at the bottom of the specific chart. If no chart label is provided, the selected locations will be used for the chart label. If no locations are selected, the visualization title will be used.
- Additional actions:
- To add additional charts to this visualization, click the add (+) symbol beneath the last chart.
- To move one chart above or below another, use the up or down arrows to the right of the location field.
- To remove one particular chart from the visualization, click the remove (-) symbol to the right of the locations field.
- To remove all charts from the visualization, click the "clear the list" (x) symbol beneath the last chart.
- Click SAVE.
Editing an Existing Visualization or Chart
To edit an existing reputation visualization:
- Click on the target visualization.
- Click EDIT in the top-right corner of the page.
- Change any value as required (see Creating a New Visualization above).
- Take additional actions as needed:
- To add additional charts to this visualization, click the add (+) symbol beneath the last chart.
- To move one chart above or below another, use the up or down arrows to the right of the location field.
- To remove one particular chart from the visualization, click the remove (-) symbol to the right of the locations field.
- To remove all charts from the visualization, click the "clear the list" (x) symbol beneath the last chart.
- Click SAVE.